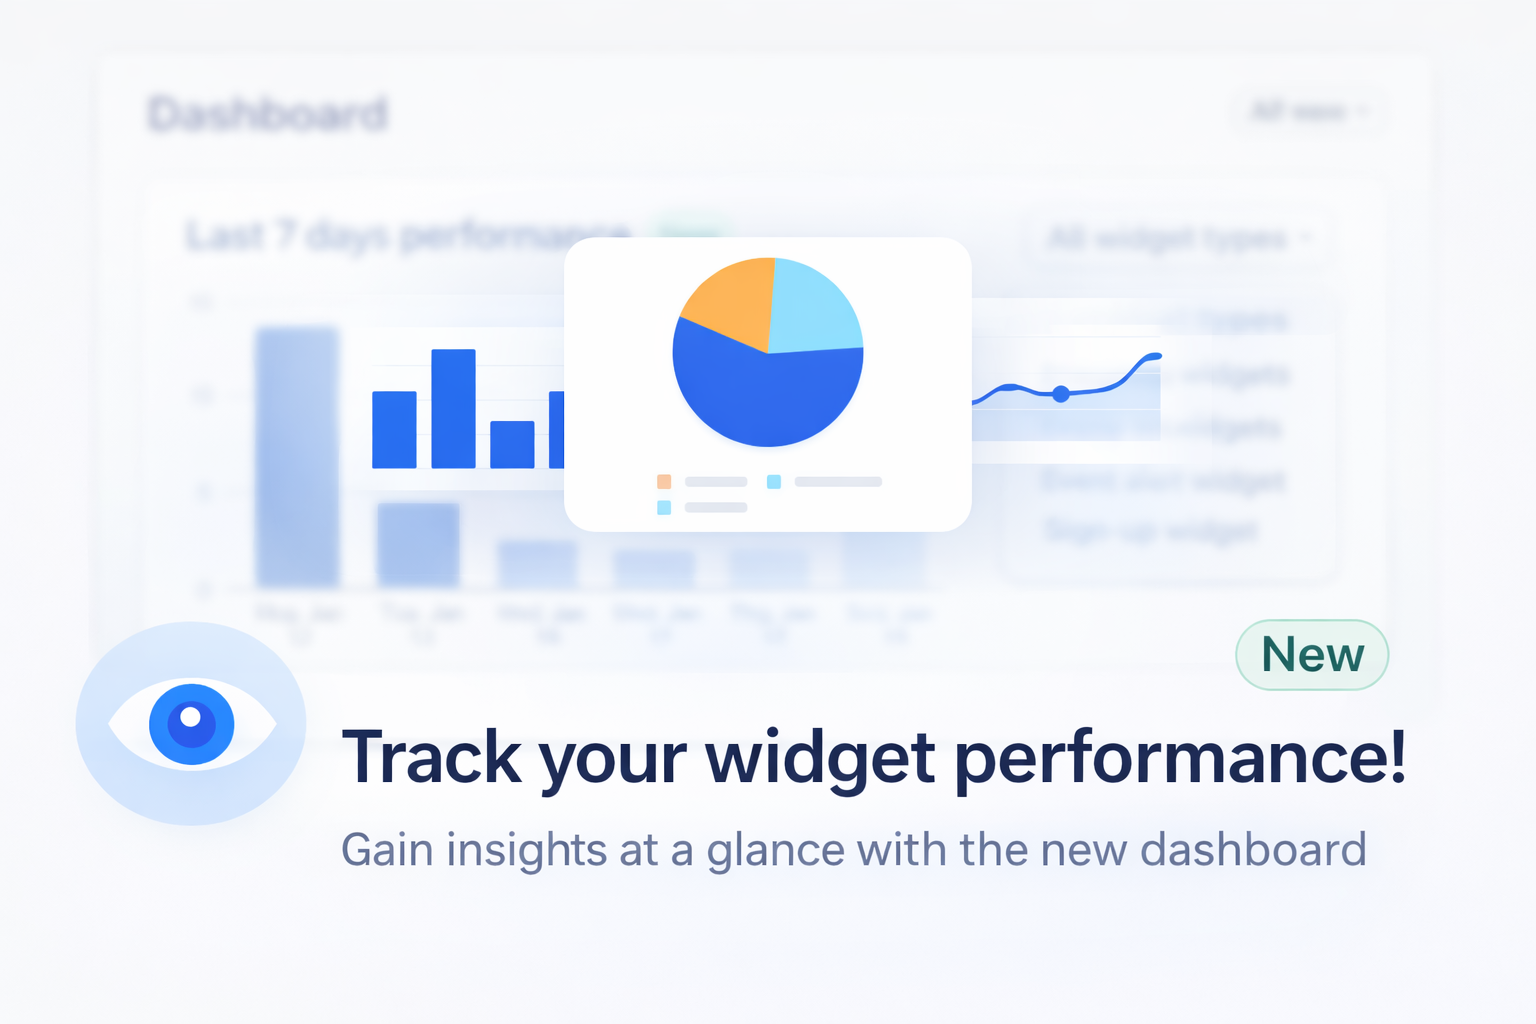
We’ve added a new dashboard widget that gives you a quick snapshot of how your widgets are performing over the last 7 days. This is a lightweight overview—not a full reporting system—designed to help you instantly understand engagement at a glance.
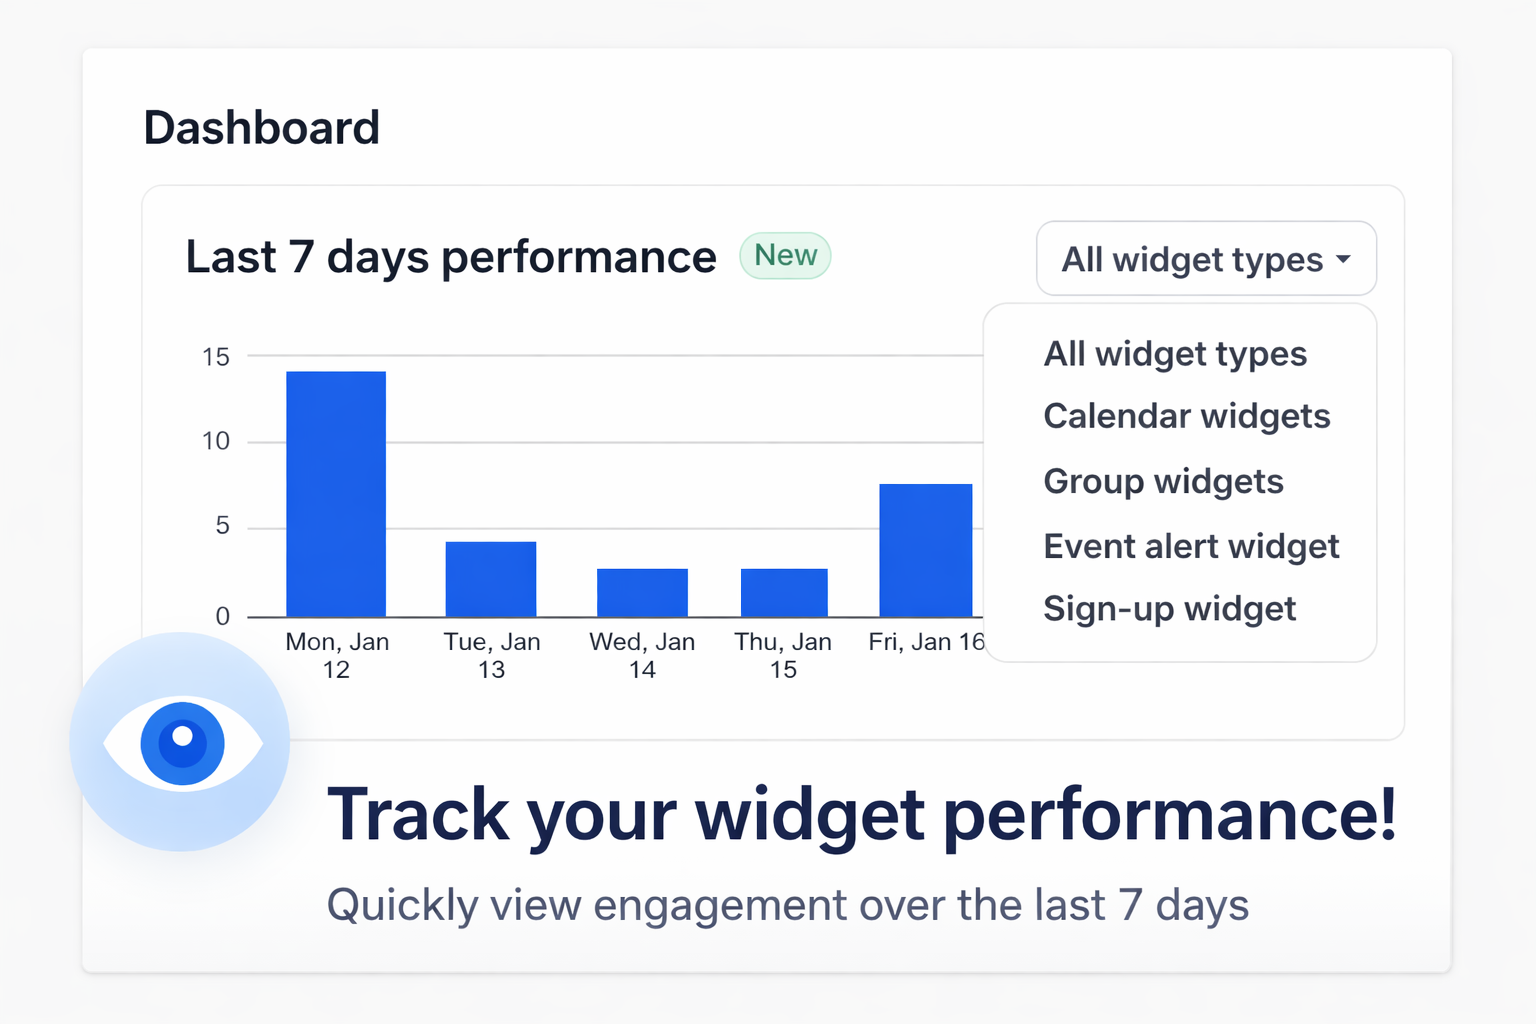
What you’ll see:
- Total widget views for the past 7 days, updated automatically
- Breakdown by widget type (All Widgets, Calendars, Groups, Event Alerts, Signup Forms)
- Daily totals grouped by date, making trends easy to spot
- Clear visibility even when there’s no activity (no more guessing)
This widget focuses on one thing: attention. It helps you quickly see how effectively your events and widgets are being viewed, without overwhelming you with data.
More advanced reporting, charts, projections, and deeper usage insights will come later in a dedicated Reports section. For now, this dashboard widget is intentionally simple—built to give you clarity in seconds and help you make better decisions about promoting your events.
Available to all users.